Description
Reco is a series of inter-related visualization tools that enable an unprecedented control and insight on the anatomy physiology correlation of the experimental data.
If you have ever needed to hand-draw your estimated recording sites and firing parameters on an atlas sheet or on a histological section image in order to enhance the degree of perception of your electrophysiology data, then you can now benefit from the innovative features offered by the Reco suite.
Reco is integrated in the same research chain with SpeedSort and neuro-Guide, from which it imports the Microsoft® Excel® database for reconstructing the recording locations of the whole experiment.
The characteristic feature of Reco is the creation of one scene where three visual information modes are embedded and spatially synchronized: 1) experiment information (i.e., recording sites and trajectories), 2) atlas sections, and 3) histology slices.
However, Reco offers you several useful features besides the realization of this multi-information scene. You can use various criteria to filter and create statistical reports based on the analysis results of your data. Also, you can browse the database of one or more experiments and for every recording site you can review the data related to the « representative » class in that record, as well as the information on the in/out location of that site relative to the targeted nucleus.
This innovative tool opens unprecedented possibilities for post-visualization and optimal perception of your electrophysiology experiments.
Exploring the experiment
Reco imports the Microsoft® Excel® format databases created by SpeedSort. The single- or multiple studies are then displayed in a structure that can be explored folder-like: group (or study)/trajectory/recording site.
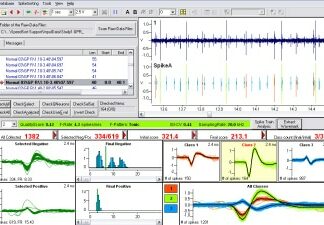
When selecting a trajectory, the program displays on that trajectory the relevant information for each recording site, such as:
- the record depth,
- all the recorded information related to the representative class detected in that signal, including the spike zone coverage, the template shape, and the general and « typical » firing raster
- the primary in/out geometrical relation of the recording site to the targeted nucleus (« nucleus fit »)
Straightforward spatial synchronization
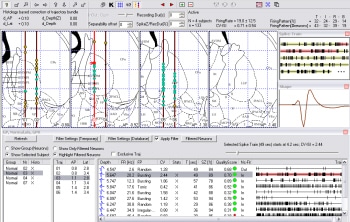
If you select a certain study, Reco automatically finds the best positional matching between the atlas sections and the matrix of trajectories. That is, the program will display for each relevant atlas section the closest experiment trajectory(ies). The sections can even be browsed (« played »), with Reco always finding and rendering the best pairing.
Each recording site is marked as a sphere on its corresponding trajectory. In order to realize the spatial matching between the experiment space and the atlas space, Reco offers a flexible set of tools for geometrical translation. Once you have located your lesioning/marking point on an atlas slice, you can simply synchronize your trajectory bundle with the atlas by matching the corresponding database site.
Intuitive rendering and optimal interactivity
Reco has powerful features to guarantee an optimal visualization and interaction experience.
The spheres denoting the recording sites are automatically color-coded by Reco, based on the value of the firing rate or of the coefficient of variation. In another representation, the « nucleus fit » information is coded using two colors.
The program offers intuitive features to increase the comfort of your study. For example, if you select a recording site (a color-coded sphere) in the image, Reco indicates the corresponding recording information in the database window, and conversely. Also, the application automatically finds a sub-set of the spike train that best represents the firing character of the overall signal, based on the mean coefficient of variation.
In Reco3D, each atlas section can be added or removed independently, enabling a natural representation, in which the fully interactive 3D scene contains: the chosen pile of atlas sheets, the model of the desired nucleus, and the trajectory bundle with the recording points.
Flexible statistics
Using Reco, you can flexibly create sets of recording points for one or several experiments. Once a set is created, Reco displays the statistics of its firing parameters. Various filtering criteria have been implemented for including/excluding sites in/from the statistical sets. For example, one can use this powerful feature to understand and evaluate the statistically predominant firing rate and pattern in a given nucleus or region, based only on signals with good quality score.
Publishing support
Reco not only allows you to visualize and understand the experimental facts, but also to export sets of spatially correlated images for your publishing purposes. The program prepares formatted atlas-experimental site scenes that you can customize and save into standard digital image formats.